 |
|
||||||||||||
|
|
|
|
|
||||||||||
|
|
|
|
|
|
|
|
|
|
|
|
|
|
|
|
|
|
||||||||||||
|
|
|
|
|
|
|||||||||
|
|
|
||||||||||||
Neocortical Dynamics: Implications for Understanding the Role of Neurofeedback and Related Techniques for the Enhancement of Attention (Previously published in Applied Psychophysiology and Biofeedback, 22(2): 111-126, June, 1997, where figures may be viewed. Only figure captions are reproduced here.) PDF Version (44KB) (Pdf version does not have figures) INTRODUCTION This presentation will consist of two parts. The first portion will provide both the scientific basis and a model for understanding neocortical dynamics and the EEG. The second portion will show how EEG biofeedback and related methodologies that modify the EEG and behavior can be explained by neocortical dynamics. During the past 22 years my colleagues and I at the University of Tennessee have been engaged in research in order to understand how EEG biofeedback now called neurofeedback influences a variety of behavioral states, particularly attention. Now, it is important to probe deeper and to try to understand how the dynamics of the brain, especially the cortex and the relationships between the cortex, thalamus and brain stem are influenced by neurofeedback. The brain is the primary organ of the body. It is responsible for the control of virtually every cell in every organ system. This control is exerted directly through the rapid acting neurotransmitters, such as glutamate and GABA, neuromodulators which are slower acting, and neurohormones which will even effect motile cells such as blood cells. The brain contains approximately 100 billion neurons. Each neuron may have as many as 2000 or more connections with other neurons and may receive as many as 20,000 inputs. There are over 250 neuromodulators, neurohormones, peptides, and transmitters. It is estimated that the number of possible connections in the brain probably rivals the numbers of all the stars in the universe. Neuroscientists are now beginning to understand this incredibly complex system from the molecular level and the neuron membrane level to the behavioral level. Neurofeedback has recently become a very potent technique for modifying behavior (Lubar, 1991). Let us examine at some of the ways by which we may be influencing brain function when we employ neurofeedback.
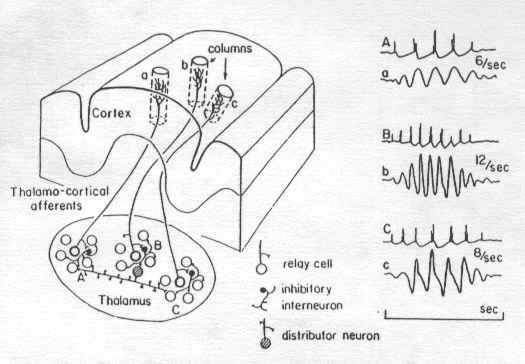
[Figure 1 (see published article for figures; only figure captions are reproduced here). General neuronal circuit of the cerebral cortex consisting of pyramidal cells (white) which are excitatory, granular cells (gray) which may be excitatory or inhibitory, stellate cells (stippled) which are excitatory, and basket cells (black) which are inhibitory. The main input layer, layer 4, receives afferents from primary sensory and other input systems. Inputs from other cortical association areas and non-specific thalamic nuclei, and the reticular formation enter the upper layers particularly Layer 2. Layers 3 and 5 are the primary output layers.] The first figure shows the typical organization of the neocortex. The neocortex of the mammal is a six layered structure. The best definition of a mammal is an animal with a six layered neocortex. None of the non-mammals have a six layered cortex and all mammals do. The cells shown in this figure are arranged in what are called macrocolumns, columns of several millimeters in diameter that are found uniformly throughout the entire cortex. This figure represents a general and a very complex circuit that we're just beginning to understand. Neocortical dynamics reflect specifically in the interaction of these different cellular types. The primary cell of importance in the neocortex is the pyramidal cell. It's known that its neurotransmitter glutamate is a potent excitatory transmitter. The pyramidal cell receives many inputs from stellate cells that are also excitatory. The pyramidal cell is different from other neurons in that it violates one of the fundamental rules of standard neurophysiology that only axons produce action potentials which transmit information from one cell to another and dendrites produce excitatory and inhibitory slow potentials that summate at the axon hillock where they establish the action potentials. In the case of the pyramidal cell the apical dendrite which is a long shaft between the basal and apical region can actually produce action potentials and these in turn act to amplify the powerful action potentials that now project to output systems--sensory, motor, autonomic, or integrative. The cortex operates by a complex interaction of excitation of pyramidal cells and inhibition by basket cells acting upon the dendrites of the pyramidal cell. In the outer layers of the neocortex, layers 1 and 2 and particularly layer 1, there are high concentrations of GABA, gamma-aminobutyric acid which is an inhibitory transmitter. The cortex receives its inputs from several sources such as the thalamus where there are pacemakers that act to modulate cortical influences from nonspecific systems such as the reticular formation and from other cortical areas. We are just beginning to understand how these different cell types interact. Pyramidal cells usually receive two kinds of inputs, one acting upon the basal dendrites in layer 4, near the base of the cell or upon the apical dendrites in the upper cortical layer, layer 1. Wherever current comes into a pyramidal cell this is referred to as a sink. Where current leaves the cell it is referred to as a source. Between the source and the sink there is a dipole, an electrical field that is set up very much like the north and south poles of the magnet. Dipoles can occur at different locations in the cell, at the base of the cell, at the middle, or at the apex. Extracellular recording electrodes pick up this information pick up the potential differences between the source and the sink. When you record within the cell (intercellularly), you record at a much higher voltage level, millivolts, than when you record outside the cell, which is where we record the EEG in microvolts. The current drop occurs across the neuron membrane which has a very high resistance. There are two schools of thought about the EEG which at first seem contradictory but they are not. One school of thought says that almost all EEG arises from intracortical loops (Thatcher, Krause, & Hrybyk, 1986; Nunez, 1995). It has been pointed out by Thatcher, Nunez, and others that 97% of the activity that occurs in the brain which we record as the EEG originates within the cortex. However, we also know that the cortex is modulated by groups of cells in the thalamus which are called pacemakers and that when these pacemakers fire they produce rhythms that we pick up as the EEG on the surface. Figure 2 shows one pacemaker firing at six pulses per second and the corresponding six hertz EEG wave. Another one is firing at twelve pulses per second, with a twelve hertz wave, and one is firing at eight pulses per second with an eight hertz wave. In fact, back in the 1960's Anderssen and Anderson (1968 ) proposed the model that the alpha rhythm resulted from the firing pattern of thalamic pacemakers. We have known for decades that the 12-17 Hz. sleep spindle can occur even if the subject or animal is decorticated indicating that thalamic pacemakers can produce some EEG rhythms independent of the cortex (Morison and Basset, 1945).
[Figure 2. This diagram illustrates the concept of thalamic pacemakers. These consist of groups of cells in specific thalamic nuclei which fire at different rates. These cells project to macrocolumns in the cerebral cortex which contain neuronal types illustrated previously in Figure 1. The right side of the diagram shows the relationship between the firing pattern of thalamic pacemakers operating at 6, 12, and 8 Hz. and the associated EEG patterns that can be recorded from the cortex. Thalamic pacemakers set up the resonances which then loop through the cortex either locally, regionally, or globally to other cortical areas.] There are several references I wish to discuss for a particular reason. Most of our information about the neocortical dynamics is quite recent. Some of these references are really extraordinarily good in terms of understanding these dynamics. They are not easy to read and they do involve more advanced knowledge. One paper by J. H. Martin (1991) provides an excellent understanding of how the neocortex operates particularly in terms of models of epilepsy. Nunez's, chapter Mind, Brain, and Electroencephalography and his book Neocortical Dynamics and Human EEG Rhythms (1995), is the most complete compendium of information on how the EEG operates that I think has ever been published. Nunez's book is highly mathematical in places, however, in between the complex mathematical material there are very good descriptive chapters. The book is quite readable if you take your time and go through it slowly. The Pilgreen (1995) chapter is very excellent in that it explains in detail the role of the electroencephalogram in understanding cognitive processes. One of the most interesting chapters in Nunez's book is the Silberstein chapter which talks about the frequency modulation of the cortex and even provides models for understanding abnormal behaviors such as schizophrenia and other types of psychopathology. Finally, Thatcher et al. (1986) provides an explanation of how different areas of the cortex are linked together through an important measure, EEG coherence. I strongly recommend that if you are interested in obtaining a very detailed knowledge of how the EEG is generated, how the cortex operates, the relationship between the cortex and the thalamus and how this relates to behavior, examine these and some of the other material that is being published in this area. Our knowledge of neocortical dynamics has progressed very far since Donald Hebb's model was proposed in 1949, in his book, Organization of Behavior. Hebb proposed the basic idea that learning involves assemblies of cells and that these assemblies of cells are continuously changing with new learning. We know that although we have 100 billion neurons and we are losing some all the time which cannot be replaced, the number of connections in our brain are continuously increasing. The more we stimulate our brain the better it gets in terms of more and more connectivity. So new cell assemblies and new circuits are being formed as we acquire new knowledge. Recall that a single neuron because of its multiple transmitters and multiple linkages can participate in many different systems perhaps even simultaneously, hence processing vision, emotional information, motor information, depending on the pattern of excitation and inhibition that it receives. The heart of what I want to cover in the first part of this presentation is the concept that the cortex works in terms of resonant loops. There are three kinds of resonances that exist in the cortex (Silberstein, 1995). Local resonances occur between macro columns, that is between one narrow column and the next. These resonances are responsible for producing the very high frequency EEG above 30 Hz. often called gamma. Regional resonances develop between macro columns that are several centimeters apart and produce the intermediate frequencies such as alpha and perhaps some of the beta activity. Global resonances develop between widely separated areas such as the frontal-parietal and frontal-occipital regions. These resonances are responsible for activity in the delta and theta range. All three resonances can operate spontaneously or they can be driven by thalamic pacemakers. There is a very nice analogy to help understand how these resonances operate called the violin analogy. When you bow a string on the violin or a similar stringed instrument it produces a specific frequency, however the resonance of the cavity of the violin produces the complexity of the sound often referred to as the timbre. In the case of the brain, the analogy would be that the strings are the thalamic pacemakers firing at different frequencies and the cortical loops, local, regional, and global operating with different synaptic delays produces the different EEG resonant frequencies are likened to resonance of the body of the stringed instrument. There is another aspect to this system. A very important nucleus that surrounds most of the thalamus is called the lateral reticular of the nucleus of the thalamus. This nucleus through inhibiting GABAergic synapses acts on relay and inhibitory interneurons and ultimately allows thalamic pacemakers to modulate their firing frequencies (Steriade, 1990). Another way of looking at this, pointed out very nicely by Nunez, is that although thalamic pacemakers produce different brain rhythms depending on which cortical loops they activate changes in the cortical loops as a result of learning, emotion, motivation, or neurofeedback for that matter, can change the firing rate of thalamic pacemakers and hence change their intrinsic firing pattern. Wendall Krieg published books (1963, 1973) in which he described very detailed dissections which actually provides the structure for these resonant loops. An example is shown in Figure 3. The very tight loops could be local or regional loops responsible for intermediate and high frequency EEG, the longer loops going from anterior to posterior could be global loops, responsible for the lower EEG frequencies. Krieg also points out that for every loop shown there are 100 million loops that are not shown. Other illustrations in his book show very tight looping particularly in the occipital lobe also frontal-occipital loops, cortical loops from gyrus to gyrus and loops that enter and return to and from the thalamus. These latter could be from pacemakers which set up resonances between the thalamus and different cortical areas. Silberstein (p. 595-596, in Nunez, 1995) illustrates how you can actually calculate by the number of synapses in a particular loop and their synaptic delay the exact frequency that that the loop will produce making the whole generation of EEG seeming almost very mechanistic and deterministic. The mathematics that he and Nunez provides adds considerable rigor to the calculations.
[Figure 3. Cortical-cortical loops as revealed by detailed dissections of the cerebrum illustrated for the lateral aspect of the brain (A) and the medial aspect (B). Loops between cortical areas as well as loops between cortical, and thalamic areas are illustrated. For every fiber shown approximately 100 million fibers are not shown (reproduced from Krieg, 1963, 1973).]
[Figure 4. Relationship between various neocortical resonant modes and brain stem neuromodulators.] Figure 4 shows another aspect of this. There is a very important relationship between the different resonant loops and the levels of different neuromodulators. There are four neuromodulators that are of particular importance which are slower acting than GABA and glutamate. These neuromodulators are acetylcholine, norepinephrine, dopamine, and serotonin. Increases in serotonin, produce what is called hypercoupling. These hypercouplings refer to large resonant loops such as the global resonances which lead to the slower frequencies, the sleep spindles, theta and delta activity. As acetylcholine, norepinephrine, and dopamine increase, they produce hypocoupled states which in turn favor the small regional and local loops leading to the higher frequencies in the EEG. For any particular activity, and for any particular state, there is an optimal coupling level. If the coupling moves too far toward hypercoupled, then attention decreases and we are unable to function very well. If coupling moves in the direction of hypocoupling then we experience very high EEG frequencies which may be inappropriate for certain particular activities as hypnosis, light sleep, or visualization. On the other hand, hypocoupling may be very important for detailed information acquisition, complex mental activity and for increased attention. We employ neurofeedback to train people to produce activity in this range that maybe associated with better learning and better attentive mechanisms (Lubar, 1991; Lubar, Swartwood, Swartwood, & O'Donnell, 1995; Lubar, Swartwood, Swartwood, & Timmermann, 1995). Now let us add another very important concept, coherence. Coherence is important because in order to understand neocortical dynamics and cortical-cortical coupling we have to have a measure that tells us the degree to which any two areas in the cortex are linked together functionally. Coherence is a statistical measure used to determine the likelihood that two random signals arise from a common generator process and the frequency bands in which this occurs. In other words, coherence is calculated for each specific frequency of interest or a group of frequencies. Coherence measures by correlation the amount of phase locking which exists between two EEG signals of specific frequencies and amplitudes over many successive time intervals which are called epochs. There are different norms for every pair of electrodes and for every age. Robert Thatcher and his colleagues have worked for more than 20 years to develop a database of coherence measures, for different ages that can be used to compare normal individuals with individuals who have experienced closed head injury or other kinds of neurological insult (Thatcher et al., 1986). From Thatcher's work it has been found that very low coherences imply that two areas are functionally disconnected. Very high coherences imply that two areas that should have been somewhat related in function are not differentiating these functions properly. The following is an example: Two very important areas of the brain lie in the left hemisphere, one is Broca's area, the other's Wernicke's area. Wernicke's area is in the posterior parietal-temporal region, Broca's area is in the frontal region. Wernicke's area is responsible for the interpretation of the meaning of language and the assemblage of letters into phonemes. This information through neocortical resonant loops is transmitted to Broca's area where it is assembled into intelligible speech and then through another series of loops to the motor cortex for articulation through output systems particularly through the cranial nerves 7, 9, 10, 11, 12 that project to the larynx, pharynx, and tongue for articulation. If the coherence between Broca's area and Wernicke's area is abnormally high (hypercoupled) this means that the two areas are not differentiating their specific functions properly. This hypercoupling leads to speech disorders and aphasias. On the other hand, if there is a penetrating wound of the brain cutting the fibers between these speech related areas, then the coherences fall to very low levels, these two areas operate independently (hypocoupled) and the information again is not transmitted from one to the other or to output systems. This could actually lead to mutism as well as other types of aphasias. In summary, coherence is a measure of the linkages in the brain particularly between cortical areas. Coherence measures change with new task demands and as new learning takes place. Coherence independent of interelectrode spacing is greater in the right hemisphere than in the left hemisphere. Thatcher, et al. (1986) reports the interesting finding that with lower measured IQ coherence becomes higher (less cortical functional differentiation). Furthermore, the frontal regions of our brain exhibit higher coherences than the posterior regions. This may be interpreted to mean that the frontal cortices favor long distance connections while the posterior cortices are more involved in local processes. For example, the posterior regions of the cortex are involved in visual processing which involves a lot of tight loops that are involved in image formation. Based on the work of Galaburda, Geshwind, Kinsborne, Thatcher, and others the left hemisphere has been shown to be strongly involved in analytical and sequential processing which would presumably require a high degree of local differentiation and short distance interactions. The right hemisphere is more involved in the synthesis and relational functions which would require long distance fibers to coordinate and relate the outputs of the distributed local processors of the left hemisphere. This is very interesting because we have known for years from the work of many investigators that the left hemisphere is involved in analytical and sequential processes, the right hemisphere more in intuitive global processes. The findings that the coherence measurements in the left and right hemisphere correspond beautifully with this older finding again shows how we can finally link together precise, mathematical models and coherence measures with neuropsychological findings. In the next portion of this presentation, I would like to turn to some studies in our laboratory that illustrate and expand on the concepts that we have been discussing. I have been interested in attention mechanisms for many years. One of the questions that we have recently seek to answer is what happens in the brain during engagement in a complex attentive task? The task we choose involved 17 subjects listening to a portion of a story from the book The Lost World which has very vivid action scenes involving dinosaurs attacking people in a treehouse. Whenever subjects became engaged in the story they pushed a switch in one direction. When they lost engagement or engrossment and their mind drifted to other things they again toggled the switch. We were able to annotate their two states on a 19-channel EEG. Visual analysis would seem to reveal relatively few differences. However, the quantitative EEG differences that were obtained were very striking. Figure 5 shows all of the significant differences in four different band passes between the engaged or engrossed and non-engrossed condition. In all cases there was increased power for the band passes shown during the engrossed condition.
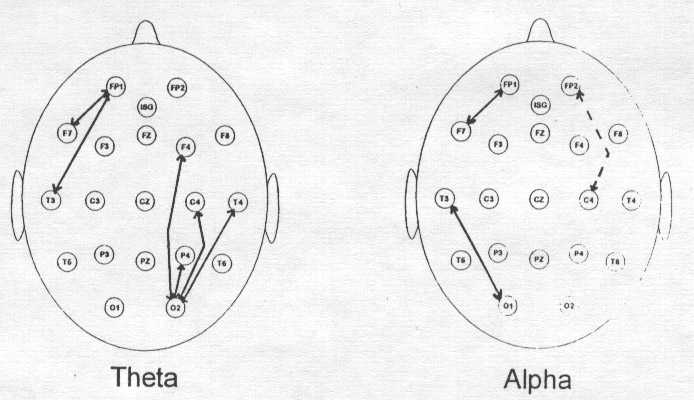
[Figure 5. Significant differences between engrossed and non-engrossed states for four different band passes. Levels of significance indicated by stars (*) illustrate areas in which there was more activity during the engrossed state as compared with the non-engrossed state (* p < .05, ** p < .01, *** p < .005, **** p < .001). All significant differences were corrected for multiple comparisons.] One of our first surprises was that we naively thought when you're really engaged in something that's complicated you should produce a lot of high frequency activity. But it's not that simple and three EEG patterns emerge. Many individuals produced increased 4-8 hz. activity particularly in lateral derivations. Some of the differences were significant at .001. The t-tests were Bonferroni corrected for multiple comparisons. Alpha activity occurred primarily in the left hemisphere and frontally, low beta and high beta were found left and central. What accounts for these differences? One explanation is that there appears to be three different types of activity involved in this auditory attentive task. One was visualization of this scene which may be correlated with the increased 4-8 hz. activity. Another is the personal appraisal or the emotions experienced by the reader in empathizing with the individuals in this scene while being attacked by the dinosaurs. In the scene one child fell out of the tree and presumably was eaten. Notice that the alpha activity occurs left and frontal. Left frontal alpha has been associated with negative affect (Henriques and Davidson, 1991). And finally, there are individuals who read the story and were primarily interested in the sequence of events. For them if you were going to make a movie, where would you place the dinosaurs, how many people in the treehouse, what did the scene look like. This is analytical and sequential and perhaps is reflected in the beta activity. This analysis of the three different types of responses is based to some extent on the verbal reports that we received from the different individuals. We also looked at linkages in the brain illustrated by coherence measures in Figure 6. The arrows connect all of the areas in which coherence was increased during the engaged task in the theta band of 4-8 Hz. as opposed to the non-engaged task. There are also some linkages in alpha. The linkages between frontal and temporal areas on the left side are primarily linkages involved with increased analytical activity. These linkages on the right side are primarily linkages that increase as a result of self appraisal, i.e., what would I experience if I were in that treehouse and the dinosaurs were attacking me. In this sense, coherences gives us some very interesting information that frequency analysis alone cannot provide.
[Figure 6. Differences between engrossed and non-engrossed states as reflected by measures of coherence. Solid arrows indicate areas in which coherence was increased during the engrossed condition. The broken arrow represents one area in alpha where coherence was decreased. See text for further explanation of these differences.] There are many ways that we can perhaps attempt to enhance cerebral activity. One that has become popular in recent years is the use of audio and visual stimulation (AVS), sound and light, which causes the brain to change its patterning of response and hence change the looping between different cortical areas. We are carrying out a series of studies to try to understand the effect of audio and visual stimulation on brain function and to see if it might be used in conjunction with neurofeedback to enhance attentive processes. In our first study we examined the effect of stimulating individuals for 20 minutes at their dominant EEG frequency, e.g., 10 hz. Of the 19 scalp locations evaluated by multivariate anlysis, the frontal pole on the left side (FP1), frontal area 3 on the left side (F3), frontal central area (FZ) and frontal area 4 on the right side (F4) were the only areas in which there were significant overall differences for all of the 19 locations. Measures of spectral power were taken after a five minute baseline, then after five minutes of continuous stimulation, ten minutes, 15 minutes, 20 minutes and then again 30 minutes later without intervening stimulation. What was particularly noteworthy was that the changes that occurred as a result of stimulating in the alpha frequency were not in alpha but were in beta between 13 and 21 hz., in other words, stimulation in alpha increased higher frequency activity in frontal areas with some carryover 30 minutes later. The percentage of increase in some cases was as high as 18% after 15 minutes of continuous stimulation and still some increase persisted at the post baseline measurement. So perhaps alpha stimulation can enhance frontal beta which we know from our other studies is involved in complex attentive tasks (Lubar & Deering, 1981, Lubar, 1991). When we employed AVS at twice the dominant frequency, in other words, 20-21 hz. then we also found increases in beta activity between 13-21 hz. These increases occurred again at area F3, at the occipital region on the left side (O1), frontal central (FZ), and right frontal (F4). There was actually some decrease in the temporal region (T3) but there was a positive rebound at the post stimulation baseline measure. In summary, beta stimulation at twice the dominant frequency produces even more frontal activation then alpha stimulation and therefore might be the more appropriate set of frequencies to use in trying to enhance neurofeedback effects for attentive processes. Now let me turn to a couple of neurofeedback studies. We published two papers recently, one in the Journal of Psychoeducational Assessment (1995) and also in Biofeedback and Self Regulation (1995) in which we showed that many individuals could learn to decrease their microvolt levels of theta over sessions. In the latter publication we showed an example of twelve individuals who successfully reduced the microvolt levels of theta (4-8 Hz.) over approximately 40 sessions. What was particularly interesting was that when we evaluated the difference between a group of people who successfully learned to change their EEG, before and after training at 19 different locations, we found that even though the training took place in locations between FZ and PZ, it generalized to most other cortical areas and many of the differences were highly significant. How is that possible? Now we can go back to the original model that I presented earlier, neocortical dynamics. What I think we have done is to have influenced resonant loops starting within the central and frontal regions and then these loops have linked through regional and global resonances to other cortical areas and caused these other areas to shift as well. Perhaps these changes also were reflected back to thalamic regions so that like the violin analogy we have the interaction between the thalamic pacemakers, the strings, and the resonances of the body, the cortex. If you want to change cortical functioning with neurofeedback you do not need to train 19 different locations, you can train one or two and the others will change in accordance with the dynamic resonant looping that is already set up in place. In contrast, in that same study (Lubar, et al., 1995) we also illustrated graphically a group of seven individuals who could not learn to decrease their microvolt levels of theta over time. When you look at their 19 quantitative EEG (QEEG) measures before and after training, there was absolutely no effect of any significance again showing that EEG neurofeedback is not some kind of nonspecific or placebo phenomenon but is linked directly to changes in cortical functioning. If you don't learn to change what is being trained, you don't change the neocortical dynamics, if you do, then you do change the neocortical dynamics and the thalamocortical dynamics as well. How long do neurofeedback training effects last? I published a paper in the second edition of Mark Schwartz's book Biofeedback: A Practitioner's Guide in which we assessed patients up to ten years after their initial training using the Connor's behavior scale. The greatest improvements occurred in very important categories including general behavior, overall attitude, getting the homework done, improved grades, relationship with family and friends, and general relationships. In summary, for many of these individuals who are now adults, a much better overall adjustment occured in the home and school settings, and, in the work place as well. Let us contrast the QEEG outcomes from neurofeedback training with the most popular of all medications that is used in the treatment of attention deficit hyperactivity disorder, methylphenidate or Ritalin. In our 1995 Journal of Psychoeducational Assessment study, we had 23 individuals with the hyperactive form of attention deficit disorder. We measured their EEG looking at theta-beta ratios, both with and without medication. The without medication measure was taken 48 hours after the last dose. As shown in Figure 7, it is quite obvious that there is no significant effect of the medication. Other studies have also indicated that Ritalin may have very little effect on the cortical EEG. The reason I point this out is that this medication and some of the others that are used to enhance attention produce state dependent learning. They work while they are in the system but there is virtually no long term carryover to the non-medicated state. Neurofeedback as I have shown works not only when it is "in the system" so to speak but the carryover lasts for a very long time and perhaps even a lifetime.
[Figure 7. The affect of administration of methylphenidate as compared with non-drug condition for 23 9-12 year old males as indicated by theta-beta ratios. Theta is defined as 4-8 Hz.; beta as 13-21 Hz. The ratios are based on power values measured in picowatts.] A recent book, Images of Mind by Posner and Raichle (1994) examines attentive mechanisms. They discuss a model called the executive attentive model. There are many kinds of attention, attention can be initiated in various sensory systems such as visual attentiveness, e.g., orientation to a visual stimulus, or orientation to an auditory stimulus. Executive attention is believed to be organized by the anterior cingulate gyrus, which then activates the frontal regions. The frontal cortex in turn activates the motor cortex, the motor cortex then carries out task, i.e., getting the homework done and so forth. I think this is interesting and may be a very speculative coincidence that our training is done right over this anterior cingulate region for ADHD. Based on the neocortical dynamics it is possible that the training is affecting some kind of looping between the area we are training and perhaps the cingulate gyrus and that in turn maybe enhancing the executive functions of the frontal regions and ultimately the transmission of this information to the motor cortex and to output systems? This of course remains to be proven. Let me summarize where we are and where we need to be. Dr. Daniel Amen has shown that many children that have attention deficit/hyperactivity disorder (ADD/HD) have frontal lobe hypo-activation (Amen, 1993). We have found EEG slowing associated with increased theta or theta-alpha in central and frontal cortex in the same population. Lou, Hendrickson, & Bruhn (1984) earlier reported decreased regional blood flow in frontal cortex, central cortex and basal ganglia. Putting this together with a number of other studies, it is quite clear that ADD/HD is a neurologically based disorder involving frontal and central cortex. Matochik's (1994) study recently showed that methylphenidate and amphetamine improved some of the symptoms of ADD/HD, does not increase cerebral metabolism but does increase blood pressure. EEG biofeedback does increase higher frequency activity, can also decrease the low frequency activity and results in long term improvements in academic performance both in normal individuals as well as in individuals with ADD (Rasey, H. W., Lubar, J. E., McIntyre, A., Zoffuto, A. C., & Abbot, P.L., 1996). Our findings have been replicated nationally and internationally by more than 700 clinics and more publications are now forth coming showing the effectiveness of this technique. For the next step we need metabolic studies employing the SPEC scan, the PET scan, or the functional MRI with measures before and after neurofeedback to determine if neurofeedback can alter cerebral metabolism. If this is the case then perhaps feedback based treatments can become the centerpiece for improving attentional mechanisms. In conclusion, what I've tried to point out is that we are just at the verge of being able to understand where the EEG comes from, how it is generated, how it reflects cortical organization, and how it reflects the dynamics that are occurring at the cortex and thalamus and the relationship between these dynamics, different behavioral states, mood states, psychopathology, and learning. For 22 years we have shown that neurofeedback can improve attentive mechanisms. Now we are beginning to see the linkage between the neurofeedback and how it changes cortical-and thalamocortical dynamics leading to long term changes in behavior. The last link is to do the metabolic studies. If we can show that neurofeedback changes cerebral metabolism, then we finally have crossed the threshold where neurofeedback may become the main treatment and medications and other approaches the alternative treatment for ameloriation of attentive disorders. ACKNOWLEDGEMENT I would like to give credit particularly to my current group of student colleagues who worked very hard with me to provide this information. I would like to thank Jon Frederick, Howard Rasey, Deanna Timmermann, and Charlse Zoffuto. A previous student who worked in our laboratory, Grant Benham, has also been involved in some of these studies. I also thank Dr. Harold Russell and The Scynetics Systems Corporation for their advice and the use of the AVS system for one of the studies discussed in this address. I wish to thank Janet Carnes for her help in preparation of this manuscript. REFERENCES
|
Email: jlubar@utk.edu
|


Established 1979 by Joel F. Lubar Ph.D., BCIA -EEG Visitor
|